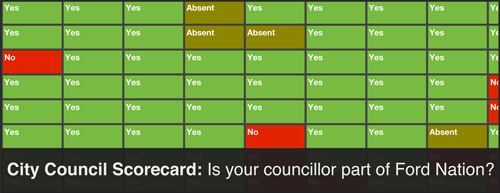
Council Scorecard
For the newest version of the City Council Scorecard, visit the new Ford For Toronto at Metro News. Click here for a direct link.
We live in confusing times. What once was the Socialist City of Toronto is now, apparently, the beating heart of Ford Nation. As a Toronto resident, you probably have a city councillor. You might vaguely remember their name and what they look like. You might not. For example, if your councillor is Vincent Crisanti.
But what’s important, Ford Nation, is that we have a sense of how our councillors are voting on the big issues. With that in mind I’ve put together this:
Current Version
- Google Docs (Best View) – See the new page for details.
Post History
- March 7, 2011 – Is your councillor part of Ford nation? Introducing the City Council Scorecard
- March 14, 2011 – How the TCHC vote went down: A City Council Scorecard Update
- May 4, 2011 – Council Scorecard Update: How did your councillor vote on city boards, bottled water, and service reviews?
- May 25, 2011 – City Council Scorecard: Garbage, Bridges, Committees & Sewage
- June 20, 2011 – City Council Scorecard Update: Selling TCHC homes
- July 19, 2011 -Â City Council Scorecard Update: Jarvis Lanes and Public Health Nurses
- October 2, 2011 -Â City Council Scorecard Update: Team Ford looks shaky with Port Lands & Service Review votes
- November 24, 2011 -Â City Council Scorecard: Voting to take out the trash
- January 09, 2012 – How often did your councillor vote with Rob Ford in 2011?
- January 17, 2012 – City Council Scorecard: The night Rob Ford last big
- February 23, 2012 – City Council Scorecard: Adding up the transit vote
About the Scorecard
The City Council Scorecard compiles voting data for major council items. The rightmost column gives each councillor a ‘Ford Nation’ percentage, which is an indication of how often they have voted with the mayor. A high number indicates that they often vote with the mayor, whereas a low number means that they are a constant thorn in his side.
Some notes on my methodology:
- I have only included certain votes that I’ve deemed ‘major.’ Yes, the definition of ‘major’ is subjective. We all learned that during the 2011 budget process. My definition in this case was any vote that received significant media attention either or was identified by the mayor as a key part of his agenda.
- The ‘Ford Nation’ percentage ignores absences. For example, if a councillor had voted once with the mayor and then been absent for every other vote, their score would still be 100%.
- In some cases I’ve flipped the votes. For example, the vote on the Urban Affairs library was actually a motion to NOT close the Urban Affairs library, so Ford’s opponents voted ‘Yes’ where his allies voted ‘No.’ I’ve flipped that in these results for consistency’s sake.
- With items relating to the Operating or Capital Budgets, I’ve used individual votes on motions (ie. Eliminating the city’s water efficiency rebate programs) as opposed to the final votes to adopt the overall budgets. I thought this was more representative of views, as a councillor could vote for an operating budget while still disagreeing with certain items within it.
- Any mistakes are my own. Data on these votes was taken from council minutes prepared by the thoroughly awesome City Clerk at toronto.ca/council. If you notice any blatant errors, please let me know via email.
- Councillors are colour-coded based on their generally accepted allegiance: for the mayor, swing vote, or against the mayor. I totally get what you mean, though, when you say that there shouldn’t be any “sides” and wouldn’t it be great if council just worked together for the greater good. That’s deep.
- This spreadsheet serves as a good resource, but please don’t make wild assumptions based on what it says. I have my biases and this only represents a selection of votes. If you want to learn more about your local councillor, your best bet is to talk to them and get a sense of where they stand on the issues.
- I will update this after every council meeting where major decisions are made.
